Solubility Predictor
Enter one or more solute SMILES strings, a temperature or a temperature range, and select the solvents. The model returns the predicted solubility as log10 of the mole fraction. It is a screening tool and does not replace measurement.
Results
Scope and limits
- Output. log10 of the solute mole fraction in the saturated solution. Mole fraction is 10log x. mol/L and g/L are derived from it assuming the solution density equals the pure-solvent density (about 1 g/mL for water), so treat them as approximate, especially at high solubility.
- Solvents. Pure solvents only, in five classes: water, alcohols, ketones, esters and aromatics. Mixtures are not supported.
- Accuracy. On held-out solutes the RMSE is 0.881 log10 units (a factor of about 7 in mole fraction). Ketones are the weakest class.
- Temperature. The model captures the temperature trend only weakly. The direction is usually right, but the size of the change is not reliable.
- Model spread. The difference between the two models (LightGBM and Bagging). It is a rough hint, not a calibrated error.
Model validation
The prediction is the mean of a LightGBM and a Bagging model. Training used 41,518 measurements (2,861 solutes). The test set has 10,494 measurements (716 solutes). The split is by solute, so test molecules were never seen in training.
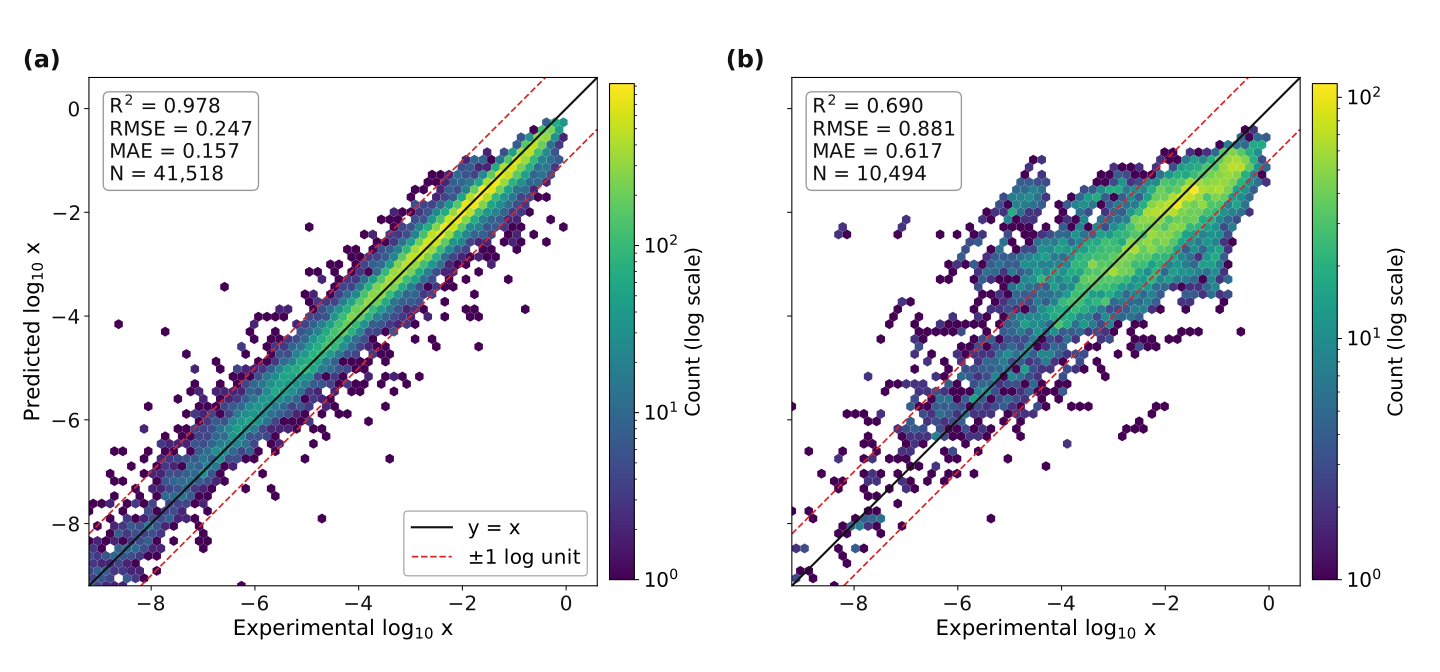
Parity plots: (a) training set, in-sample fit. (b) test set, held-out solutes. Colour shows the number of points per hexagon. Dashed lines mark ±1 log unit.
Regression metrics
| Data | N | R² | RMSE (log10 x) | MAE (log10 x) | Within 1 log unit |
|---|---|---|---|---|---|
| Train (fit, in-sample) | 41518 | 0.978 | 0.247 | 0.157 | 0.993 |
| Train (5-fold out-of-fold) | 41518 | 0.743 | 0.838 | 0.633 | 0.803 |
| Test (held-out solutes) | 10494 | 0.690 | 0.881 | 0.617 | 0.819 |
The in-sample row is optimistic because the model has seen those molecules. The out-of-fold and test rows are the honest estimates.
Test-set metrics by group
| Group | N | R² | RMSE | MAE | Within 1 log unit |
|---|---|---|---|---|---|
| water | 2819 | 0.834 | 0.786 | 0.538 | 0.849 |
| alcohol | 5117 | 0.407 | 0.841 | 0.592 | 0.822 |
| ketone | 962 | 0.285 | 1.234 | 0.884 | 0.712 |
| ester | 1074 | 0.413 | 0.907 | 0.682 | 0.812 |
| aromatic | 522 | 0.532 | 0.928 | 0.668 | 0.835 |
| Handbook | 2236 | 0.878 | 0.706 | 0.484 | 0.875 |
| BigSolDB | 8258 | 0.464 | 0.923 | 0.653 | 0.804 |
Classification view (F1 score)
The model is a regressor. To report F1, solubility is binned by log10 x into three classes (below −4, −4 to −2, and −2 or above). The bin edges are illustrative and were not used in training.
| Train (fit, in-sample) | Precision | Recall | F1 | Support |
|---|---|---|---|---|
| Low (log x < -4) | 0.964 | 0.898 | 0.930 | 6547 |
| Moderate (-4 to -2) | 0.917 | 0.948 | 0.932 | 18218 |
| High (log x >= -2) | 0.955 | 0.947 | 0.951 | 16753 |
| Macro F1 / accuracy | 0.938 | acc 0.939 |
| Test (held-out solutes) | Precision | Recall | F1 | Support |
|---|---|---|---|---|
| Low (log x < -4) | 0.821 | 0.551 | 0.660 | 1733 |
| Moderate (-4 to -2) | 0.664 | 0.804 | 0.727 | 4434 |
| High (log x >= -2) | 0.798 | 0.732 | 0.764 | 4327 |
| Macro F1 / accuracy | 0.717 | acc 0.733 |
Validated 2026-10-15 using the deployed model files. Re-running them on the original test set reproduced the saved test predictions (max difference below 1e-10).